News & Insights

Investing in International Small Cap: The Beauty of Inefficiency

We have long believed that human emotion and behavioral tendencies move stock prices in the short-term. These price moves are often reactions to events that have limited impact on long-term intrinsic value—this inefficiency creates opportunity. To take advantage of these opportunities, we empower an experienced research team to employ a disciplined, long-term focused approach. In small cap markets, these opportunities can be even more pervasive because the opportunity set is larger and research coverage is smaller.

More than 18 years ago, Hotchkis & Wiley launched its US Small Cap Diversified Value strategy. The strategy takes a distinct approach to evaluating a large universe, by prioritizing stocks for research and conducting efficient analyst reviews. One of the primary objectives was to do the opposite of most active small cap managers: focus disproportionately on the smaller end of the small cap market. Most small cap peers have little presence in this part of the market because trading can be a challenge. Our solution to this was simple: create a highly diversified portfolio with small maximum and average position sizes. We believed we could add value disproportionately in this subsegment of the market because it is inefficient—less research coverage in this part of the market leads to more mispriced opportunities.

This is not to say that all overlooked investments are good ones. In fact, there are many risky and/or overvalued stocks in inefficient segments of the market. In our opinion, a passive approach in this part of the market would lead to owning a lot of weak and risky businesses. Research depth and a disciplined framework are required to distinguish mispriced opportunities from risky/overvalued prospects—traits that are hallmarks of Hotchkis & Wiley.

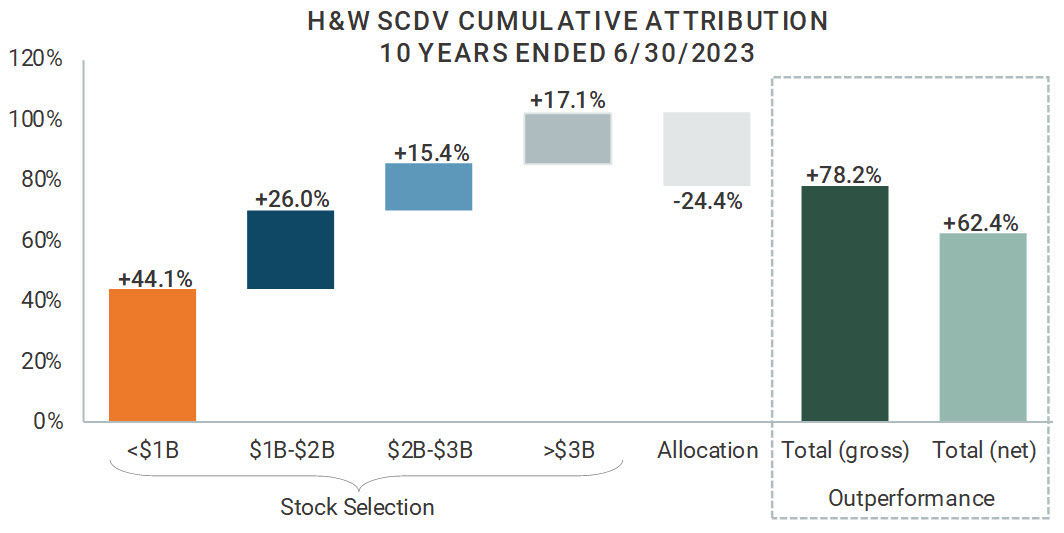
Fortunately, performance has transpired as designed in the US Small Cap Diversified Value strategy, as shown in the chart below. The strategy has outperformed, with a disproportionate amount of the outperformance coming from positive stock selection in stocks with a market cap of less than $1 billion.

About 5 years ago, we began to explore an international small cap strategy that would be managed in a similar fashion. We have been managing global strategies for more than a dozen years and have been conducting research in international markets considerably longer than that. We found that the small cap opportunity set in non-US markets shared some of the same important characteristics as the US, most notably vast breadth and lack of research coverage. We believed that we could take advantage of this like we have in the US strategy, leveraging our deep global value research platform and disciplined investment process. We officially launched the strategy on June 30, 2020, and results from the first three years have been promising.

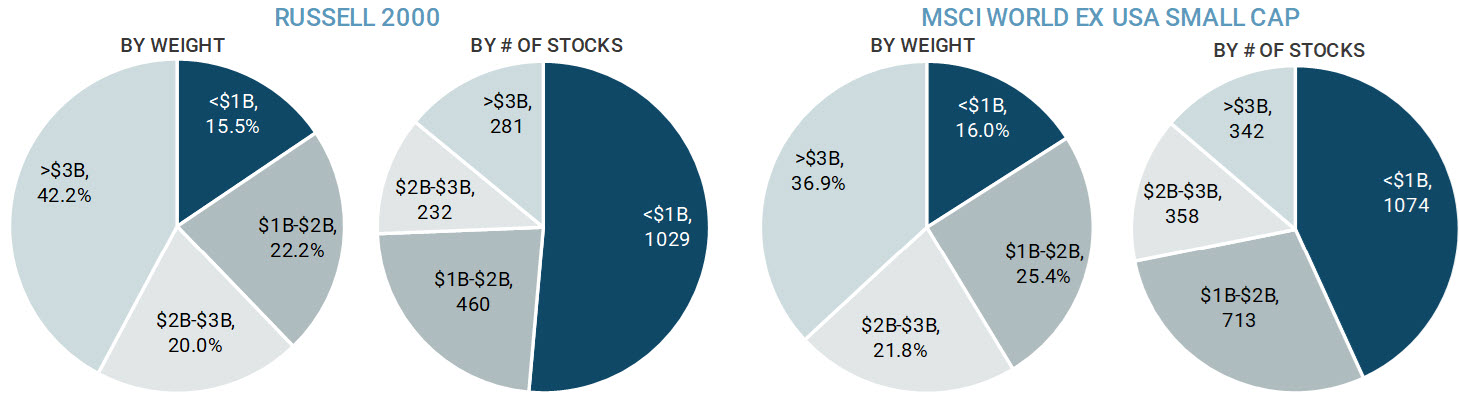
The following chart shows the US small cap index compared to the non-US small cap index. By weight, i.e., market cap, about 40% of both indexes are in stocks with a market cap of more than $3 billion (USD), and only about 15-16% are in stocks with a market cap of less than $1 billion. By number of stocks, however, those under $1 billion in market cap represent a much larger share of the index. Both indexes have more than 1,000 stocks in the sub $1 billion range, or close to half of all securities in the index. These are broad opportunity sets that are likely to contain numerous overlooked ideas. If we were to include non-benchmark names, which we do in our investment process, the number of potential ideas in this cohort would be even larger.

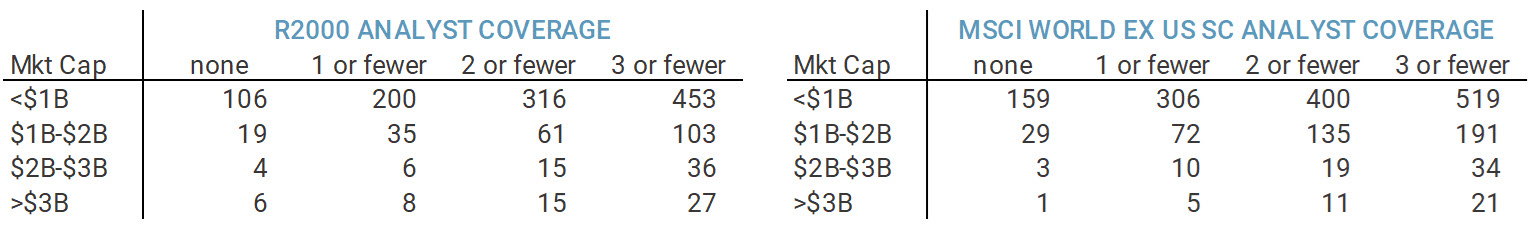
We believed our deep research platform and disciplined investment process could add disproportionate value in the smaller subsegments of the small cap market due to its inefficiency. The tables below show a sell-side coverage summary for the US small cap index compared to the non-US small cap index. It establishes that the level of research coverage becomes less and less the smaller the stocks get, and this is even more prevalent in international markets. We believe these numbers understate the true coverage differences, because it is common that the most junior sell-side analysts start with coverage of smaller stocks while experienced analysts more often cover larger caps. This creates an opportunity for a diversified strategy with an experienced research team and a structured process.

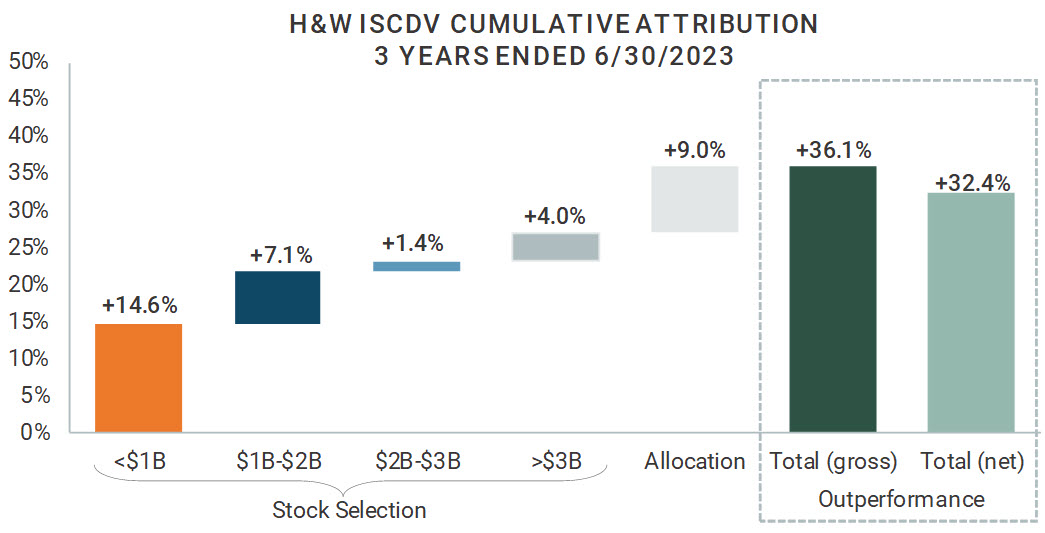
The table below shows the performance of the International Small Cap Diversified strategy relative to the broad and style benchmarks, respectively, over its three-year history.

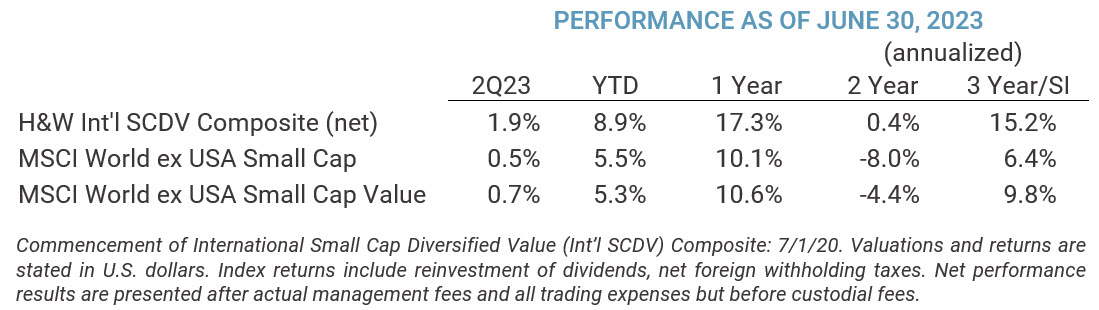
Like its US counterpart, the strategy has outperformed meaningfully, with the largest source of outperformance being positive stock selection in stocks with a market cap of less than $1 billion.

Small cap equity markets are inefficient due to a general lack of coverage from both buy-side and sell-side researchers. Within small cap markets, the inefficiencies become even more extensive in the smallest subsegments. Our 3-year-old International Small Cap Diversified Value strategy leverages the same deep research platform and same structured approach as our more seasoned US version to exploit these inefficiencies. While the international strategy is nuanced to address differences in corporate governance, accounting, and political risks across geographies, the underlying core competencies are the same. Like the US version, our international small cap strategy was designed to take advantage of an inefficient opportunity set in a systematic fashion—an advantage that we believe should persist for the foreseeable future.


______________________________________

Source: H&W, Russell, MSCI, Bloomberg, representative H&W Small Cap Diversified Value (SCDV) and International Small Cap Diversified Value (ISCDV) portfolios. Client portfolio holdings and characteristics may vary due to different restrictions, cash flows, and other relevant considerations.

Net of fee performance for the SCDV Composite as of 3/31/24: 17.59%, 10.47% and 8.93% for 1-, 5-, and 10-year, respectively. Net performance results are presented after actual management fees (including performance-based fees if applicable) and all trading expenses but before custodial fees.

All investments contain risk and may lose value. Investing in foreign as well as emerging markets involves additional risk such as greater volatility, political, economic, and currency risks and differences in accounting methods. Investing in smaller and/or newer companies involves greater risks than those associated with investing in larger companies. A value-oriented investment approach involves the risk that value stocks may remain undervalued or may not appreciate in value as anticipated. Value stocks can perform differently from the market as a whole or from other types of stocks and may be out of favor with investors and underperform growth stocks for varying periods of time.

The portfolio manager’s views and opinions expressed are subject to change without notice and may differ from others in the firm, or the firm as a whole. The portfolio manager’s comments may include estimated and/or forecasted views, which are believed to be based on reasonable assumptions within the bounds of current and historical information. However, there is no guarantee that any estimates, forecasts or views will be realized. Any discussion or view of a security, an asset class/segment, industry/sector and/or investment type are not investment recommendations, should not be assumed to be profitable, and are subject to change without notice. In the event of new information or changed circumstances, H&W reserves the right to change its investment perspective and outlook and has no obligation to provide revised assessments and/or opinions.

Information based on forecasts, proprietary or third-party estimates cannot be guaranteed and is subject to change. Information obtained from independent sources is considered reliable, but H&W cannot guarantee its accuracy or completeness. Certain information contained in this material represents or is based upon forward-looking statements. Due to various risks and uncertainties, actual events/results or performance of the strategy(s) may differ materially from those reflected or contemplated in such forward-looking statements.

The value disciplines used in managing accounts in the SCDV and ISCDV strategies may prevent or limit investments in major stocks in the respective indexes and returns may not be correlated to the indexes. Composite performance is available at www.hwcm.com, located on the strategies Performance tab along with important disclosures included in the strategies SCDV and ISCDV GIPS Reports; quarterly characteristics and portfolio holdings are located on the Portfolio and Literature tabs. Portfolio information is subject to the firm’s portfolio holdings disclosure policy.

The Russell 2000® Index measures the performance of the 2,000 smallest companies in the Russell 3000® Index. The Russell 2000® Value Index measures the performance of those Russell 2000® companies with lower price-to-book ratios and lower forecasted growth values. Russell Investment Group is the source and owner of the Russell Index data contained herein (and all trademarks related thereto), which may not be redistributed. The information herein is not approved by Russell.

The MSCI World ex-USA Small Cap Index is a free float-adjusted weighted index capturing small cap representation across 22 of 23 Developed Markets (DM) countries, excluding the United States. The MSCI World ex-USA Small Cap Value Index is a free float-adjusted weighted index capturing small cap representation, exhibiting overall value style characteristics, across 22 of 23 Developed Markets (DM) countries, excluding the United States. The indexes assume reinvestment of dividends and capital gains (net foreign withholding taxes), and assume no management, custody, transaction or other expenses. MSCI makes no express or implied warranties or representations and shall have no liability whatsoever with respect to any MSCI data contained herein. The MSCI data may not be further redistributed or used as a basis for other indices or any securities or financial products. This report is not approved, reviewed, or produced by MSCI. See Index definitions for full disclaimer.

Attribution is an analysis of the portfolio’s returns (gross of fees) relative to the index (SCDV - Russell 2000 Value and ISCDV - MSCI World ex-USA Small Cap); stock selection includes interaction effect. Bloomberg calculates returns using daily holding information. Returns calculated using this buy-and-hold methodology can differ from actual client portfolio returns due to data differences, cash flows, trading, and other activity (report is generated at a point in time and will not include any adjustments thereafter). The Carino smoothing method is used to link quarterly attribution. Analysis for different time periods and/or market environments can result in significantly different results.

©2024 Hotchkis & Wiley. All rights reserved. This material is provided on a confidential basis and may not be reproduced in any form or transmitted to any person without authorization from H&W.

Past performance is not indicative of future performance.