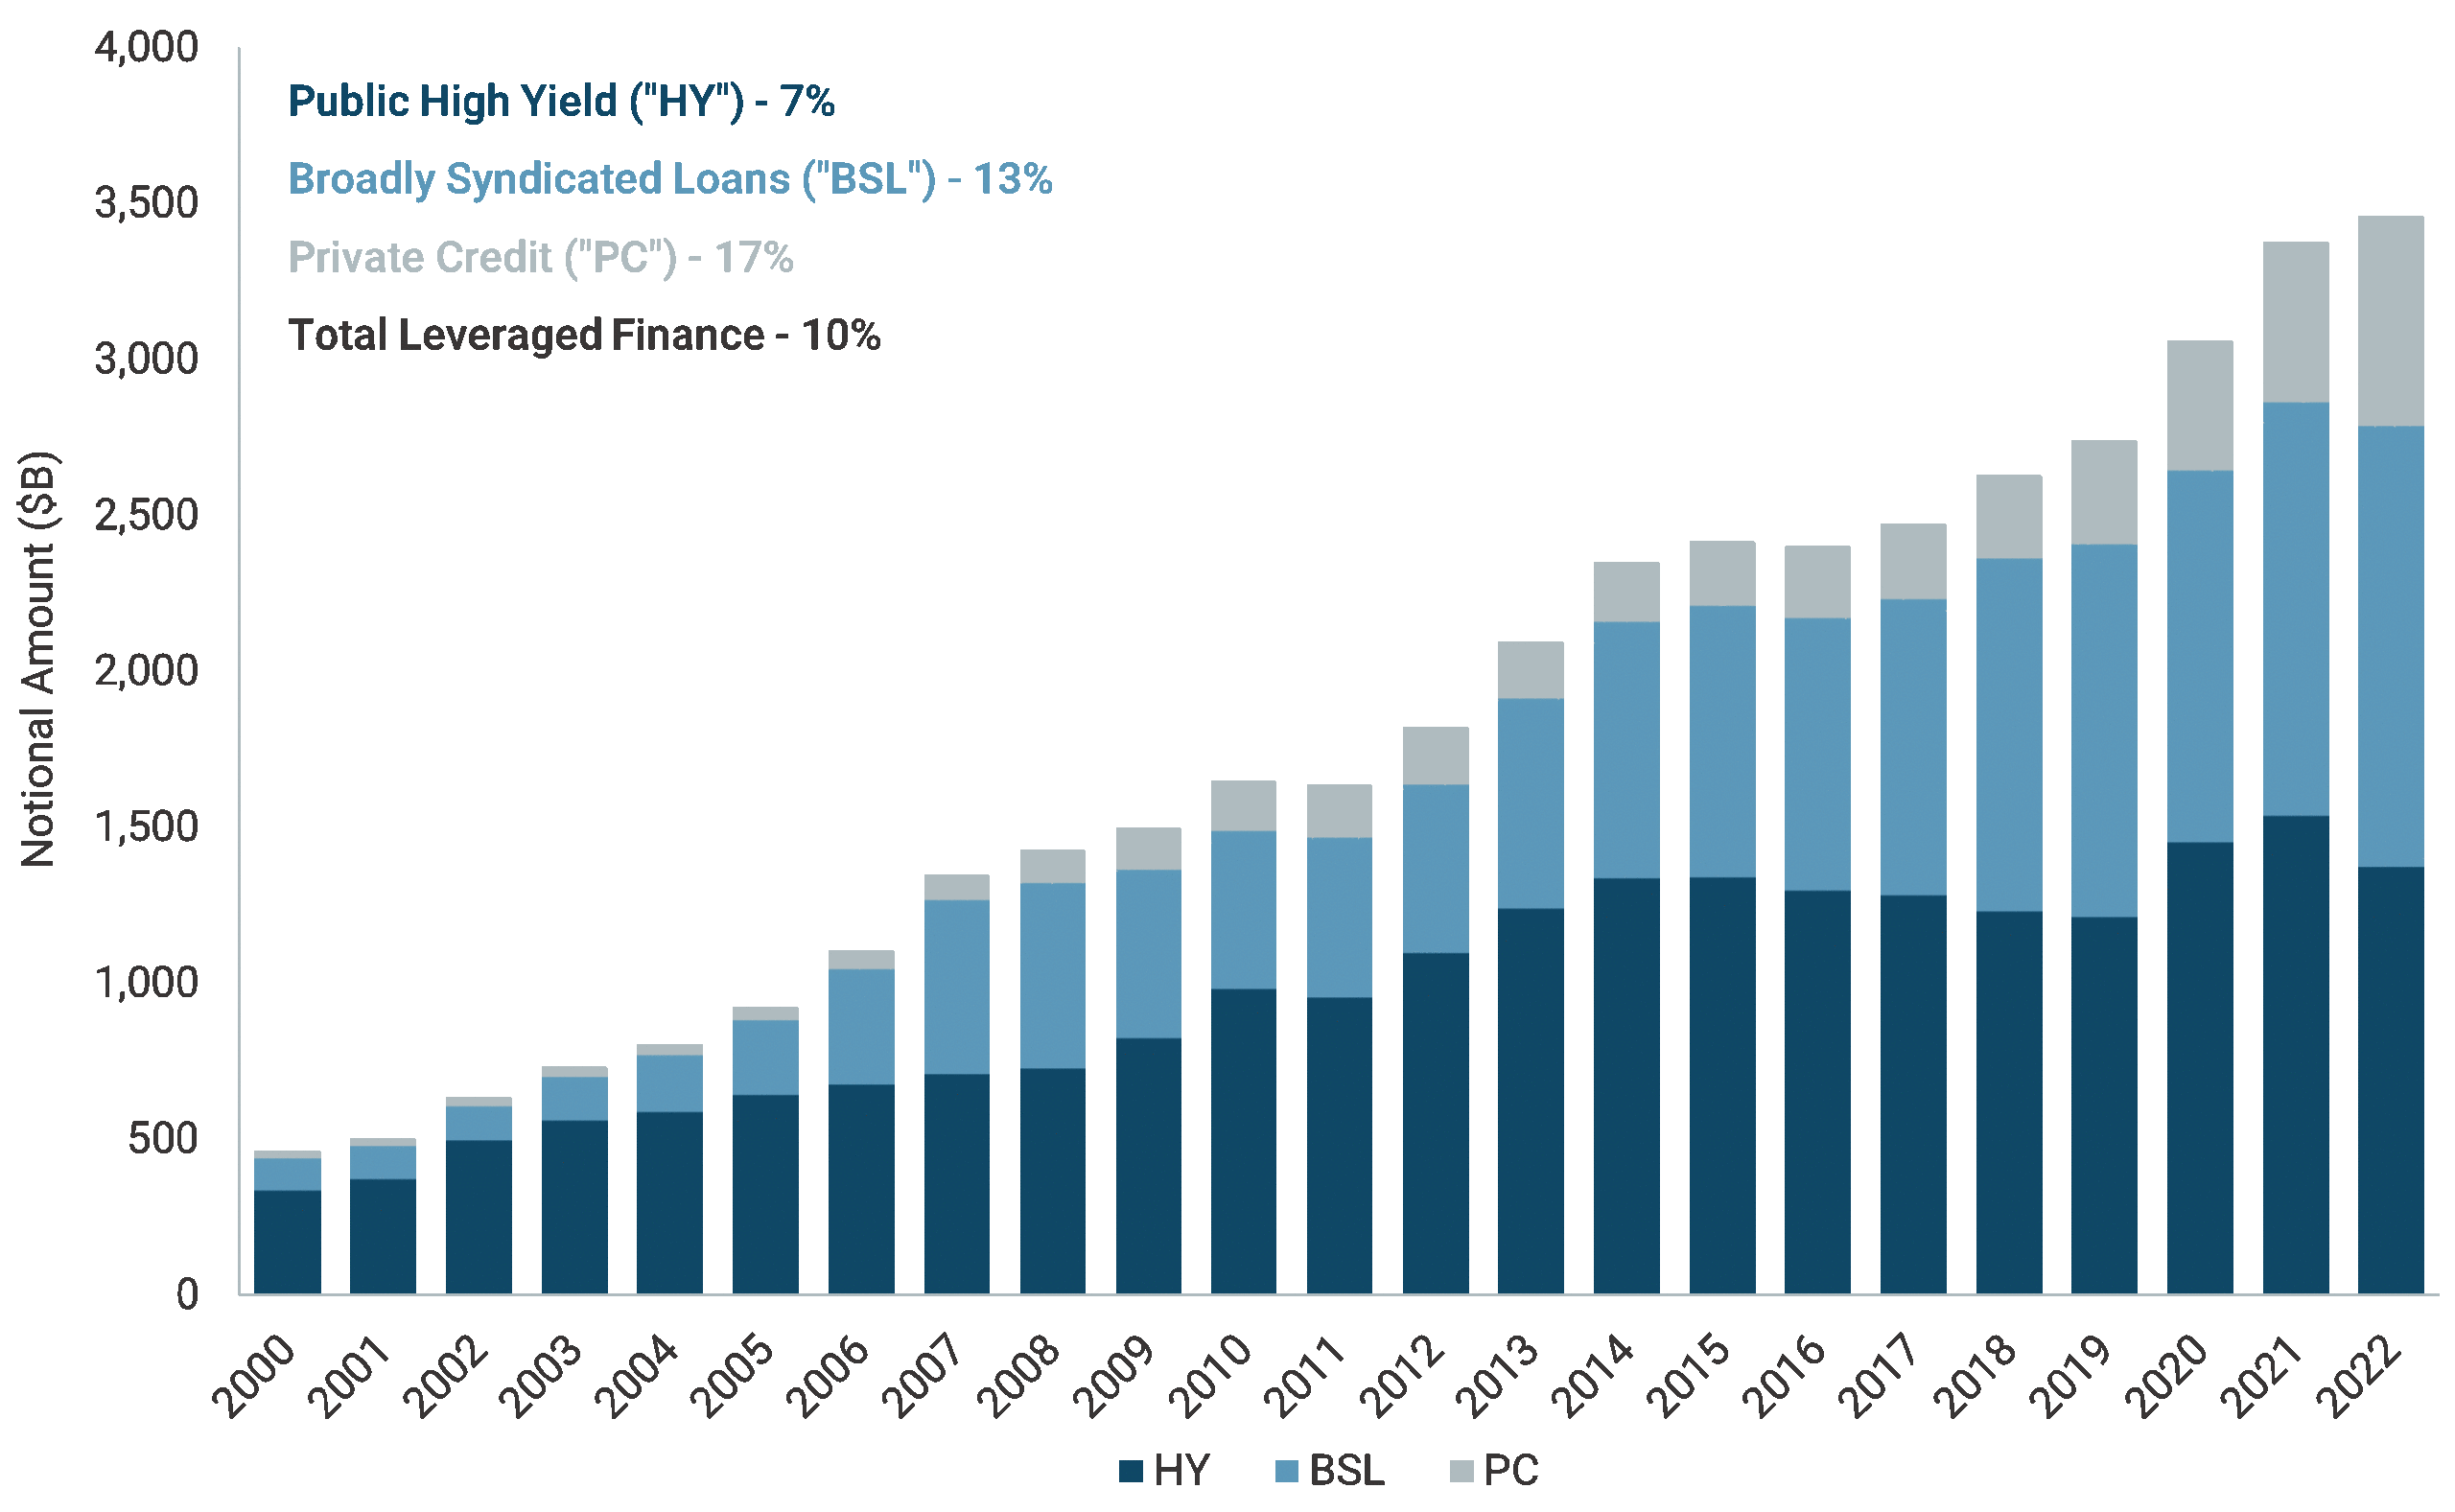
Leveraged Corporate Credit has grown dramatically since 2000. We define leveraged corporate credit to include Publicly Traded High Yield bonds (HY), Broadly Syndicated Loans (BSL), and Private Credit (PC). Chart 1 shows that Leveraged Corporate Credit has grown by a constant annual growth rate (CAGR) of over 10% from December 2000 through December 2022. For reference, Nominal US GDP grew at 4.6% across the same period. As such, leveraged corporate credit has expanded at 2.2 times the rate of growth of all goods and services produced in the US over the past two decades. What’s more, within the leveraged corporate credit domain, there have been significant shifts in the respective sub-markets.
Chart 1: Leveraged Corporate Credit

In the early years of the 21st century up to the Global Financial Crisis (GFC), HY was the vehicle of choice for leveraged corporate borrowers. However, the combination of a flat yield curve, growing Collateralized Debt Obligation (CDO) demand, and a surge in M&A ignited an increase in BSL from 2004 to 2008. By 2008, HY was only 22% larger than the BSL market. After the GFC, HY resumed its dominant trajectory and BSLs retrenched as a byproduct of concerns about structured products and secured leverage vehicles, especially in the aftermath of M&A/LBO restructurings from the period. At this juncture, PC began to emerge as a niche funding alternative, especially for borrowers with unusual lending profiles or fast turnaround requirements. HY also suffered some contraction in the aftermath of the Energy, Metals and Mining crunch in the 2015-2018 period. BSL, on the other hand, benefited issuers because of its funding linked to historically low LIBOR and afforded investors secured alternatives to the mainly unsecured HY market. The result was BSL growth that significantly outpaced HY. PC also benefited from the low LIBOR basis and was able to customize funding solutions outside of the normal BSL underwriting fairway. By 2022, BSL eclipsed HY as the largest leveraged corporate credit silo. What is more, PC had grown to exceed $1T of notional outstanding, representing 31% of the total leveraged corporate credit market.
The first implication of the growth of the overall leveraged corporate credit market and its respective silos is that we have seen an increasing differential utility among the issuers and buyers within the three sub-asset classes.
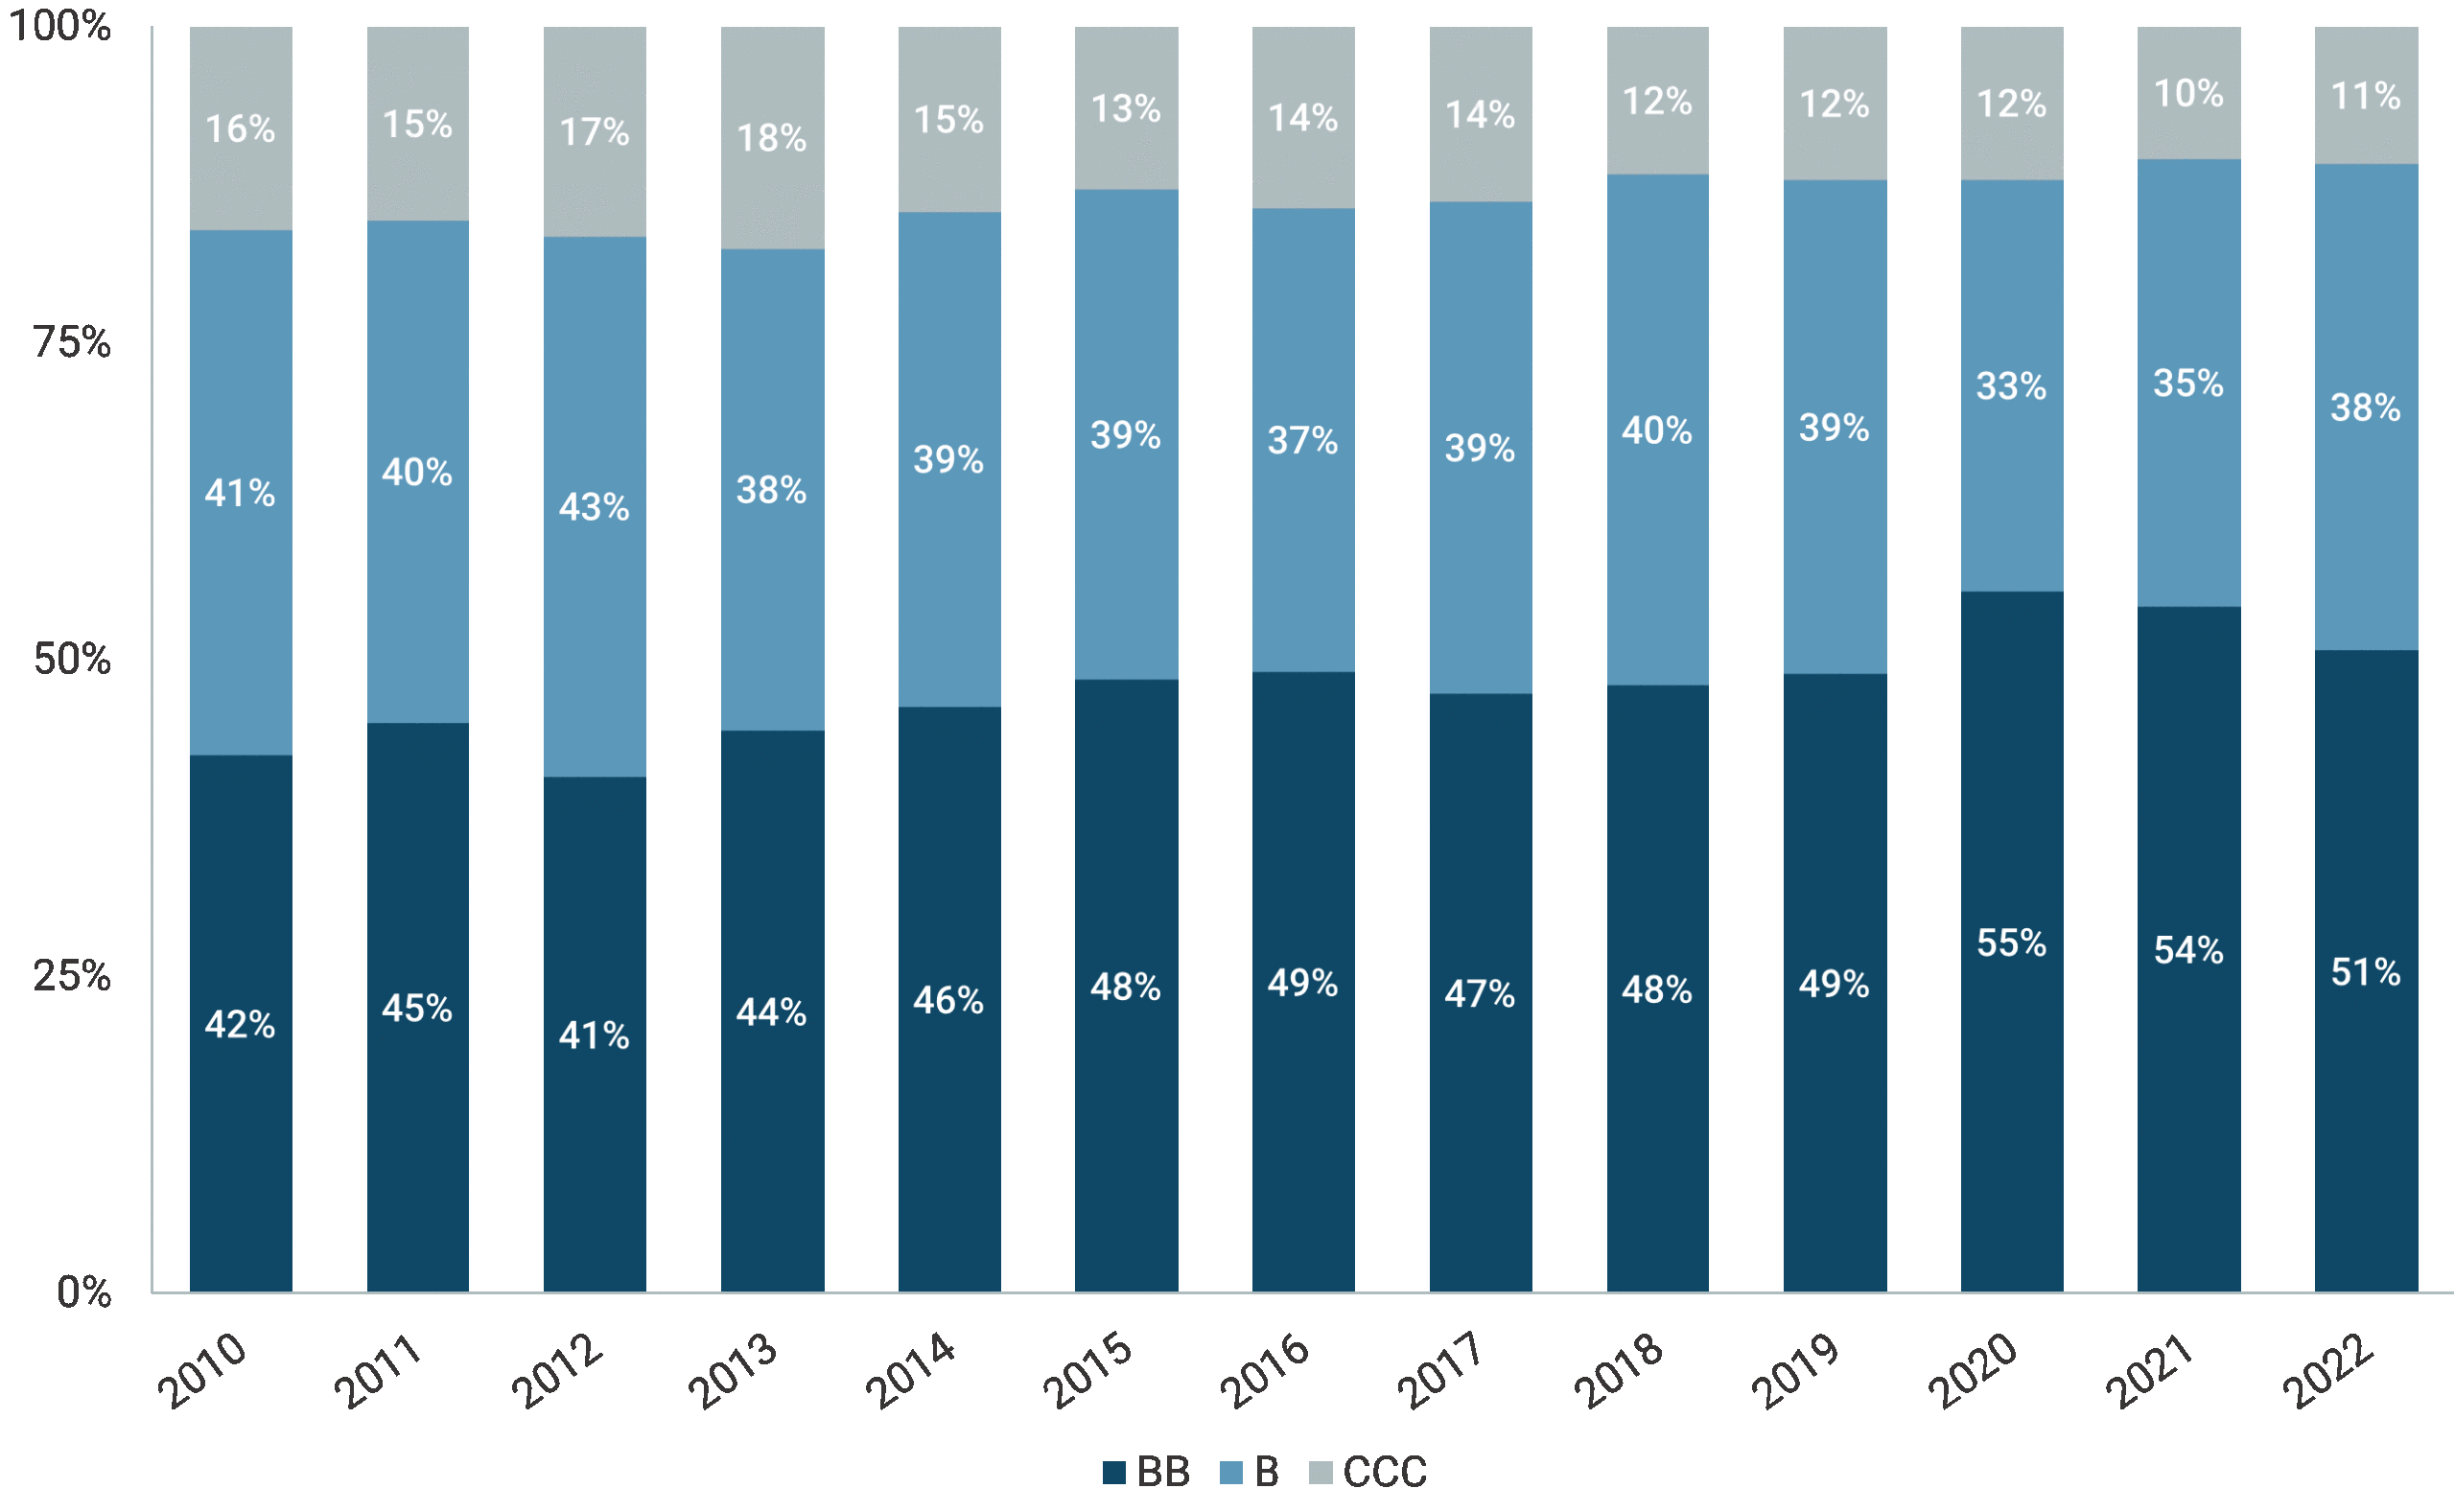
Chart 2: Public HY Rating Mix

HY has developed into the mature leveraged corporate credit market. Issuers appear to value placement into this market to ensure public securities continuity as a longer-term strategy or as a bridge to IPO or other public capital market exercises. Implicit to this strategy is that HY issuers must adhere to higher quality expectations compared to the past. Recently, HY has benefitted from Fallen Angles derived from the credit carnage from the 2015 through COVID period, and we expect to see a modest erosion of the proportion of BBs as the Fallen Angles become rising stars. Nonetheless, it does appear that a resilient trend is in place that encourages the lower-quality rungs of leveraged corporate credit to be issued into the BSL and PC silos.
BSL’s development is more complicated. Originally, the BSL market was a subset of the broader leveraged loan market. Early on, banks held material exposures in their loan books to leveraged companies, across the capitalization spectrum. As the leveraged credit market grew, banks found that they could syndicate loans into new buyer camps like mutual funds, hedge funds, and structured buyer vehicles. This allowed banks to share some of the risk and converted a mainly buy-and-hold market into one with enhanced liquidity. The net result was a vibrant and growing BSL market.
Much changed in the immediate aftermath of the GFC. Re-regulation of the bank sector had a dampening effect on bank interest in leveraged company exposure, especially in the smaller and middle market (SMID) segments. What emerged was a very robust BSL segment that increasingly cannibalized the traditional buy-and-hold bank portfolio channel. At the same time, the GFC resulted in much higher risk premiums paid for structured product placement. This further complicated the leveraged bank loan market because the largest consumers of bank loans since the mid-2000s were structured vehicles, including Collateralized Debt Obligations (CDOs) or more recently Collateralized Loan Obligations (CLOs). These vehicles represent, on average, 70% of BSL new issue demand. As premiums for the senior-most tranche in these financing vehicles expanded, potential equity returns declined. To make these collateralized structured products work for both the senior-most and equity constituents, the underlying loan collateral had to deliver more yield. More yield results from more risk.
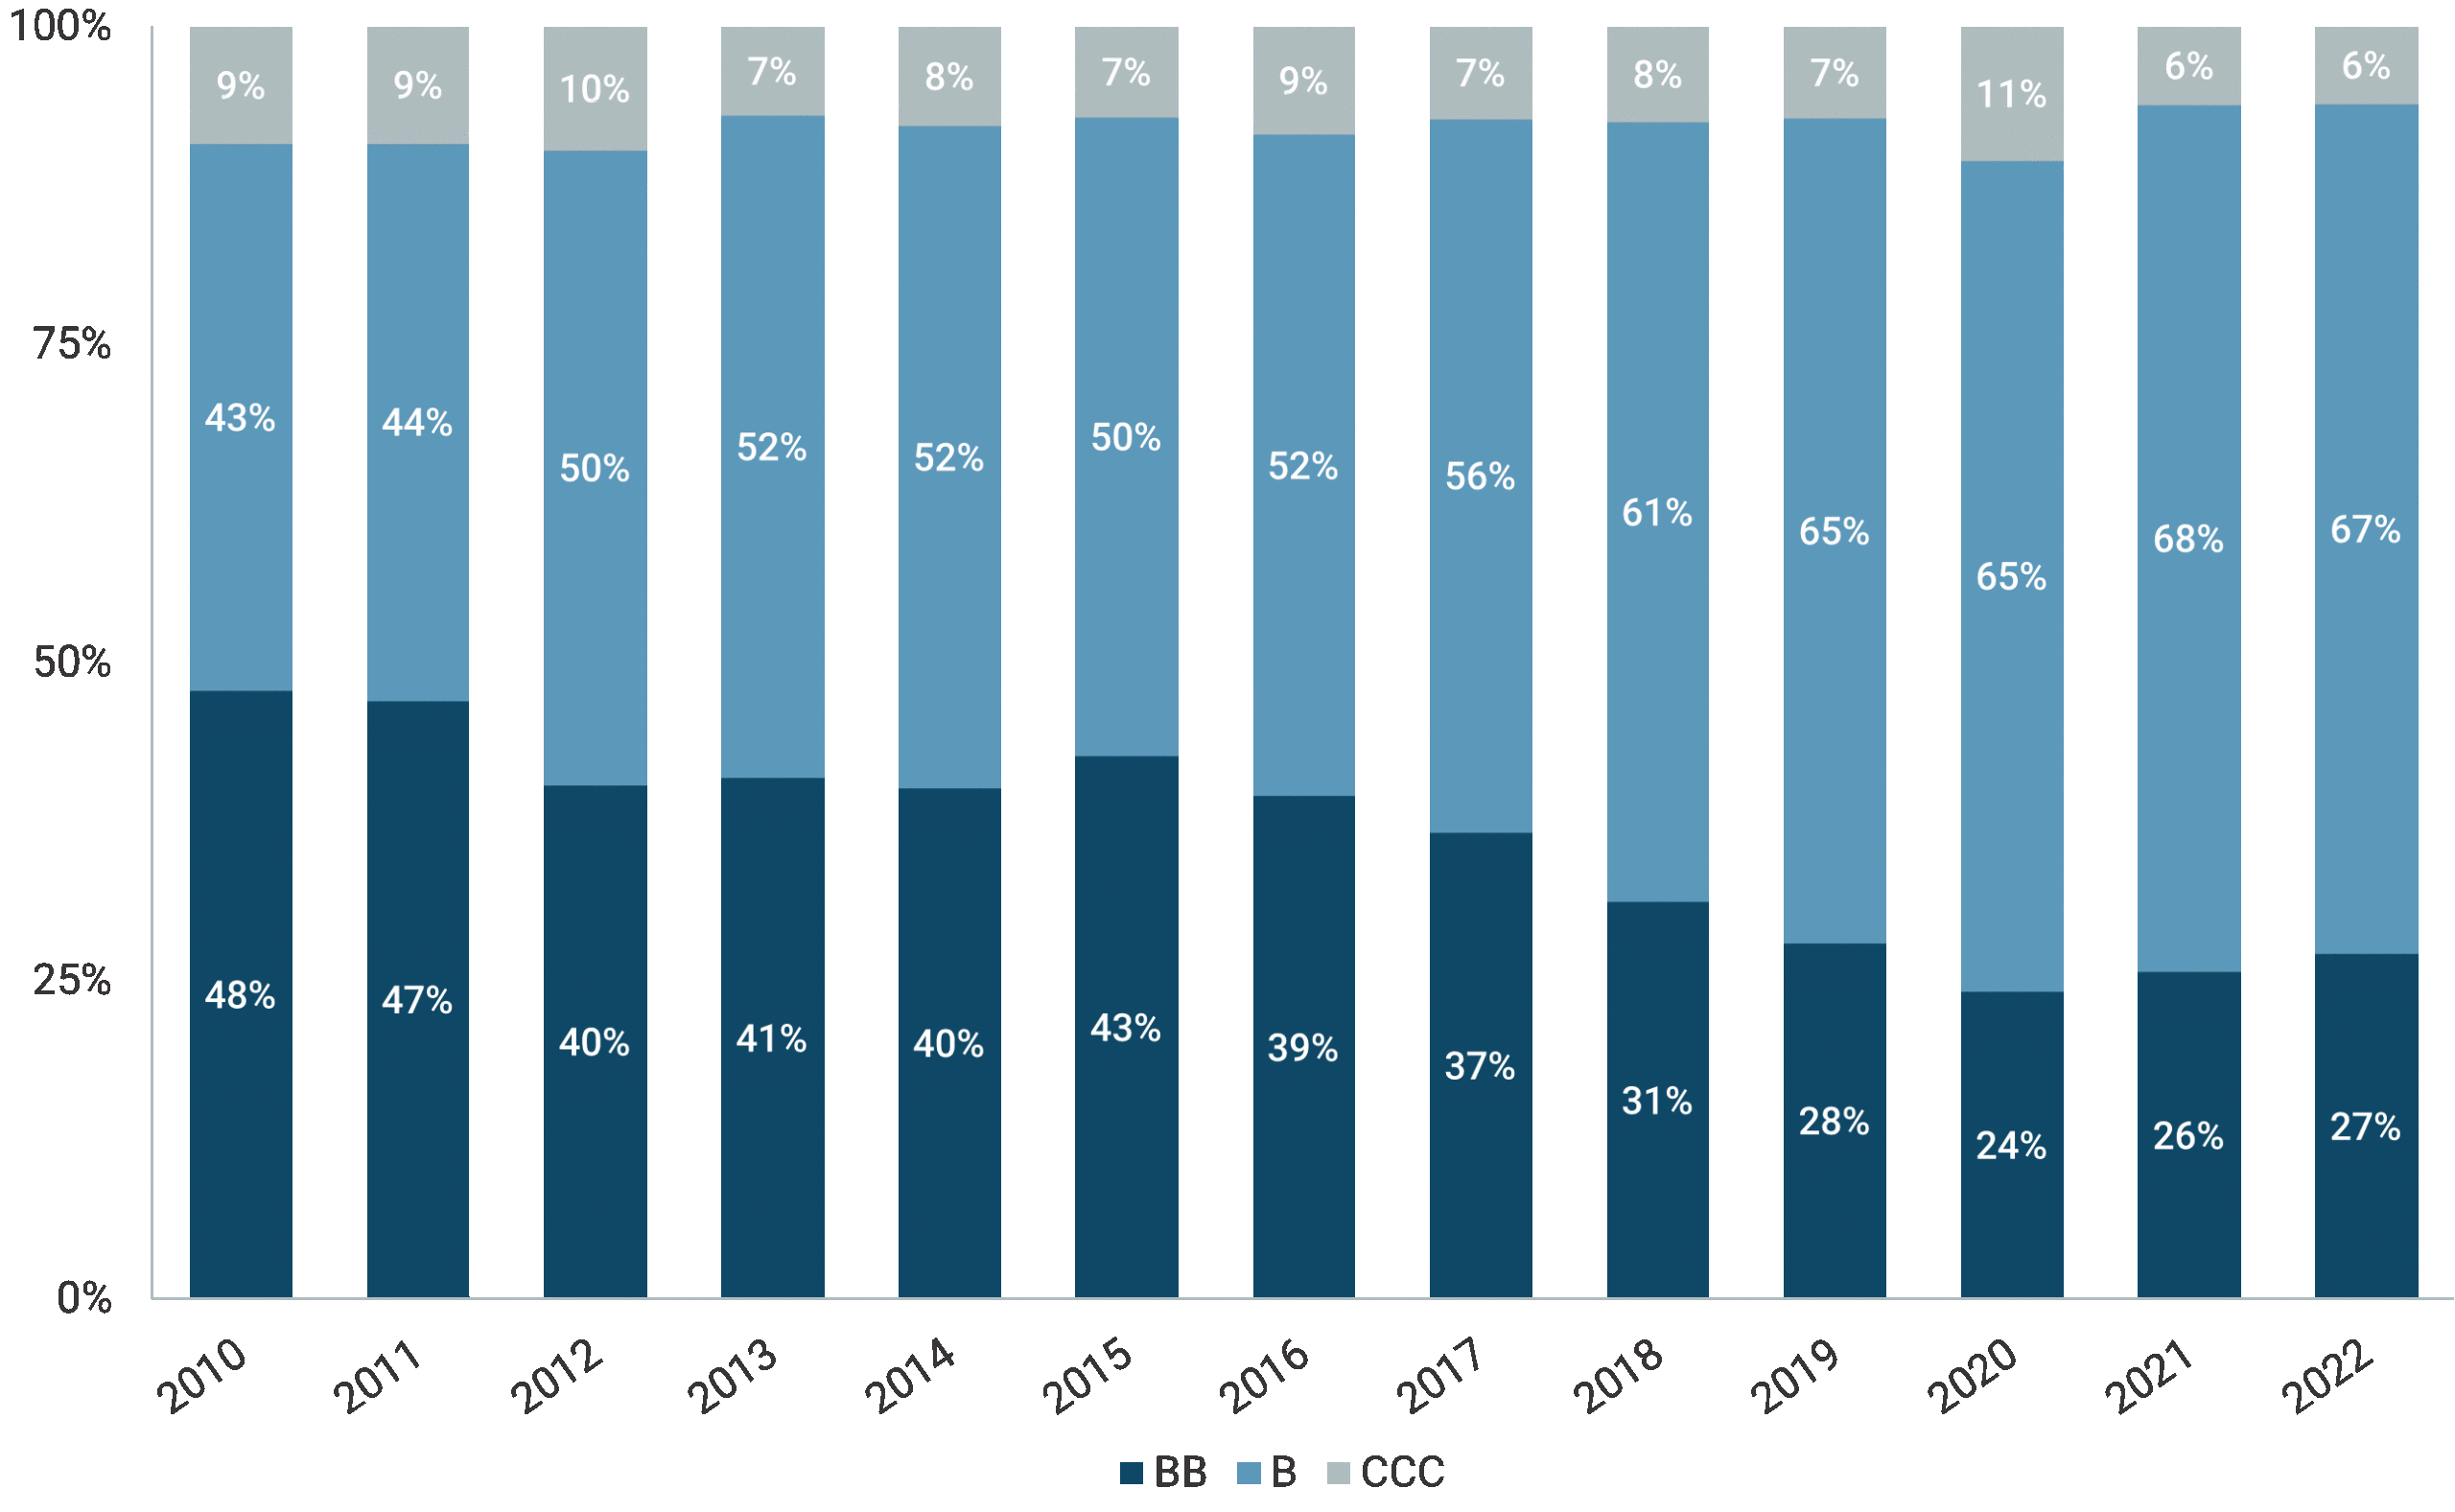
Chart 3: BSL Rating Mix

Chart 3 shows the stair-step decline in quality of the BSL market over the past 12 years. This credit deterioration follows directly from growth in the CLO market and the need for these structures to underwrite collateral with higher spreads. Obviously, near-zero policy rates during the post-GFC period to mid-2015 and 2020-2021 compounded the problem. Thus, over the past 20 years, we’ve seen the BSL market grow and evolve into a much lower-quality market compared with the HY market.
PC is clearly the emerging venue. It was a niche market that didn’t really start expanding until the low-rate environment emerged in the post-GCF era. Like the BSL market and in some ways related to HY’s evolution, the growth in PC appears to be driven by the retrenchment in bank lending, particularly within the SMID segment. Other outliers, like LBOs and other complicated capital market transactions requiring leveraged debt components, found the post-GCF regulatory environment simply would not tolerate the risk. In stepped the post-GFC new entrants including Business Development Corporations (BDCs) and other non-regulated buyers who were more than willing to underwrite customized lending solutions. In addition, these entrants deepened the penetration of PC within the SMID segment to include firms that had previously been unable to find financing. In doing so, they found a fertile landscape for underwriting opportunities and growth.
From our perspective, the byproduct of these changes is a migration of marginal leveraged corporate credit from the traditional HY silo into newer, more issuer- accommodative BSL and PC sub-segments. HY has benefited from a credit quality perspective which should lead to lower default-related credit losses. BSL has benefited in terms of growth but at a cost to quality and a dependency on the CLO funding arbitrage. PC fits somewhere either at the intersection of HY and BSL or in the green field domain that heretofore could not access institutional funding, most notably within the SMID segment.
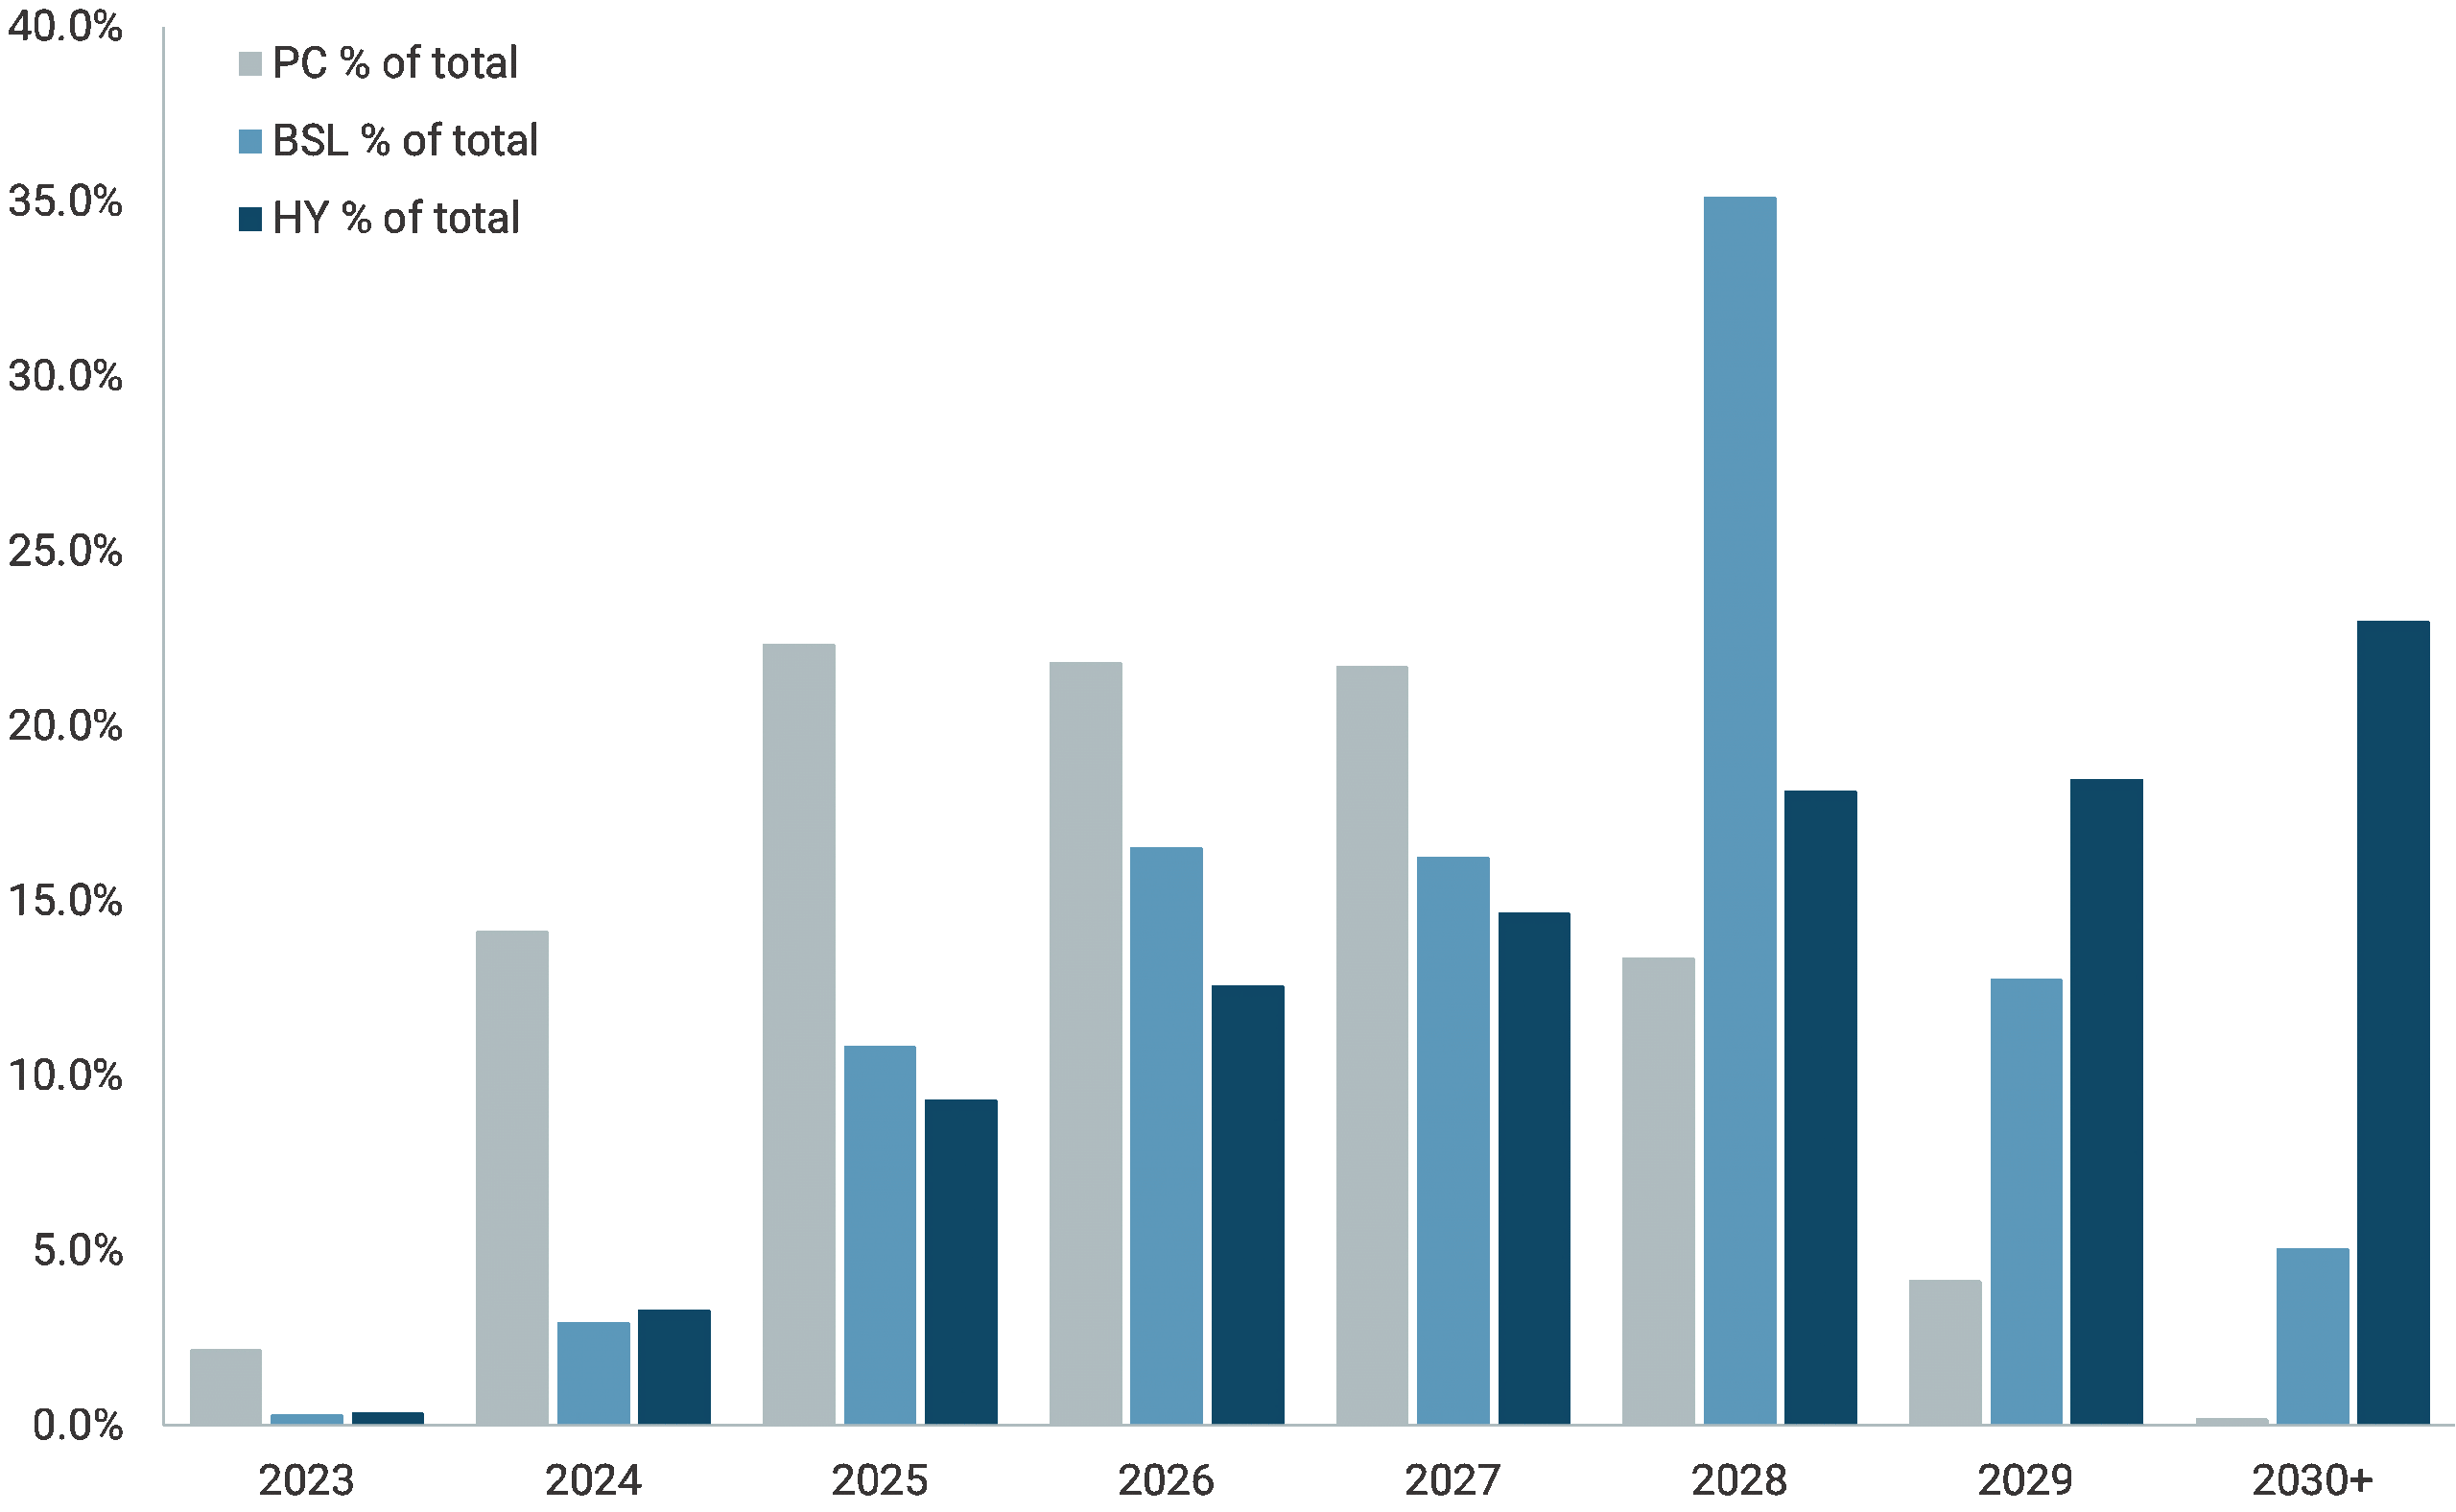
Looking forward, we may see a test to each of these funding silos in the near-to-medium term. Chart 4 shows the projected maturity distributions associated with these three silos for the balance of this decade.
Chart 4: Refinancing Percentage by Leveraged Finance Sector

In order of concentration risk, PC will be presented with the first set of challenges due to significant refinancings in each of the next four years. This may not be as ominous as it appears insofar as the very nature of the PC market, in theory, allows for relatively efficient refinancing, mainly by extension of existing structures. Whether theory and reality converge or diverge will probably come down to the extension economics and the progress the underlying issuers have made in managing interest expenses since they first tapped the PC markets. Likewise, an open question remains as to whether PC firms will need to seek outside financing or syndicate some portion of the refinancing wave, especially if some of their issuers require restructuring. Syndication within the PC silo may prove to have a finite limit. Syndication outside of the PC silo might prove especially challenging.
The BSL market is next in line to be tested. Refinancing concerns dramatically build in the 2025-28 period, with 2028 being an existential challenge. The good news is that roughly two-thirds of the BSL market is held by CLOs and it is very commonplace for CLOs to undergo their own form of refinancing extensions. This will aid the BLS market by offering the potential for proximate refinancing extensions, both collateral and structured vehicles. Like PC, the real test to the BSL market will hinge on how the underlying issuers have dealt with the 5.25% increase in overnight funding over the past 18 months and to what degree a mark-to-market of individual credit quality upon refinance produces significant increases in its crediting spread.
In the coming years, HY will face challenges similar to those within the BSL silo in terms of maturity distribution. However, unlike the BSL market which faces a massive peak in 2028, the HY maturity schedule increases in near-linear fashion from 2025 through 2030. This is a more moderated maturity schedule. Moreover, unlike the BSL market which faced increasing overnight rates that stepped up in conjunction with the Fed’s tightening program, HY is dominated by fixed coupons placed into the market during the 2020 and 2021 issuance surges which occurred at historically low base rates. These low coupons (Par-weighted coupon and price in HY is currently around 6% and $88.00) have somewhat insulated HY issuers from interest rate mark-to-market. This will change as we move into 2024.
Summary
- HY credit quality has improved over the past decade. We expect some decline in BBs as a percentage of the overall HY market as Rising Stars exit the universe, but the overall improvement in the quality of HY appears to be a resilient trend.
- BSL quality has declined over the past decade. Given the CLO-linked structural demand of this sub-segment, we do not expect a reversal of this trend in the near-to-medium term.
- Given the relative shifts in credit quality within HY and BSL, we expect BSL defaults to continue to exceed HY defaults. What is more, we expect loan recoveries to continue their recent deterioration relative to HY into the medium term.
- All three sub-asset classes within leveraged corporate credit will face refinancing challenges in the coming years.
Conclusion
At HWCM HY, we believe our bottom-up credit-picking focus should benefit from the higher credit quality trend within the HY market. Moreover, we expect multiple new issue opportunities as the new issue calendar builds to ameliorate the looming refinancing challenges across all three silos of the leveraged corporate credit market.